Automating vCenter and Host Log Bundle Collection with PowerCLI

Manually collecting log bundles from vCenter and hosts can be repetitive and time-consuming. Here’s how I automated the process with PowerCLI. I wanted a short script that would let me pick a vCenter server, then do the other relevant tasks:

  • Export the vCenter log bundle
  • Pick any single cluster & export a log bundle from the first three hosts in the cluster

Troubleshooting: Underlying connection was closed

When I attempted to use the PowerCLI Get-Log command to generate a bundle, I was met with the error: The underlying connection was closed: A connection that was expected to be
kept alive was closed by the server.
This led me to a knowledge base article with resolved the issue:

Set-PowerCLIConfiguration -WebOperationTimeoutSeconds 2700 -Scope:User

This sets the timeout for such operations from a default 5 minutes to 45 minutes (2700 seconds). After setting the timeout for the user, I needed to exit and relaunch my powershell window for the setting to become effective.

Sample Script

The following sample script assumes you are connected to a vCenter Server to which you’d like to collect logs.

$dateString = (Get-Date).ToString('yyyyMMdd')
$newFolder  = (New-Item "D:\tmp\VCLogExport\$dateString" -ItemType Directory).FullName

Get-Log -Bundle -DestinationPath $newFolder
Get-Cluster | Get-Random -Count 1 | Get-VMHost | Sort-Object Name | Select-Object -First 3 | Get-Log -Bundle -DestinationPath $newFolder

The few lines of code will:

  • Create an output folder with the current date
  • Export a vCenter log bundle
  • Select a single cluster at random, select the first three hosts from that cluster and create a log bundle for each of them. Note: If the selected cluster has fewer than 3 hosts, fewer than 3 bundles may be created.

Conclusion

By increasing the PowerCLI timeout and using just a few lines of script, what was once a repetitive monthly manual process can now be automated and kicked off in just a few minutes. The log bundles will still take some time to generate, but this will happen in the background without attention. This approach not only saves time but also ensures consistency in how log bundles are collected for troubleshooting or archival purposes.

Posted in Scripting, Virtualization | Leave a comment

Simulating vCenter Server Connection Failures with iptables

I was recently testing an application and wanted to see how it would behave if its connection to vCenter Server was interrupted. Would the process auto-recover? Would I need to restart a service? To find out, I simulated a connection failure using the built-in firewall on Photon OS. This type of testing can be helpful when validating resiliency, troubleshooting connection handling, or preparing for real-world outages.

The application was running on a Photon OS appliance, so I checked to see if the native iptables firewall was enabled using the following command:

systemctl status iptables.service

This returned a confirmation that the status was loaded/active, pictured below.

Since the firewall was enabled, I checked its configuration using the command:

iptables --list --line-numbers

This lists all the rules and their associated line numbers in the configuration. At the end of the configuration, I could see a block of OUTBOUND requests, which allow everything (based on rule 7).

Chain OUTPUT (policy DROP)
num  target     prot opt source               destination
1    ACCEPT     tcp  --  anywhere             anywhere             state NEW tcp dpt:https
2    ACCEPT     tcp  --  anywhere             anywhere             state NEW tcp dpt:http
3    ACCEPT     tcp  --  anywhere             anywhere             state NEW tcp dpt:ssh
4    ACCEPT     tcp  --  anywhere             anywhere             state NEW tcp dpt:https
5    ACCEPT     tcp  --  anywhere             anywhere             state NEW tcp dpt:http
6    ACCEPT     tcp  --  anywhere             anywhere             state NEW tcp dpt:ssh
7    ACCEPT     all  --  anywhere             anywhere
8    ACCEPT     icmp --  anywhere             anywhere             icmp echo-reply
9    ACCEPT     icmp --  anywhere             anywhere             icmp echo-reply

For my testing, I only needed to create a rule above number 7 that would DROP the requests to the specific vCenter Server my request was going to. I waited for the application to start, then added this firewall rule to drop requests to the vCenter Server, effectively simulating a network interruption:

iptables -I OUTPUT 7 -d 192.168.127.40 -j DROP

Caution: these changes are meant to be temporary and should only be used in test environments.

I then ran the same iptables --list --line-numbers command and confirmed that rule 7 was now my DROP entry and the previous rule 7 (that allowed all traffic) shifted down to rule number 8.

Finally, after testing, I could remove the rule:

iptables -D OUTPUT 7

Conclusion

Using iptables makes it easy to simulate a loss of connectivity to vCenter (or any other target system) without touching physical network infrastructure. This approach is lightweight, repeatable, and useful for testing application resiliency or recovery processes. Just remember that iptables changes made this way are not persistent across reboots, so they’re ideal for temporary testing in a lab or non-production environment.

Posted in Lab Infrastructure, Virtualization | Leave a comment

Blocking Internet Access in a vCenter Lab with Selective Proxy Access

While troubleshooting a vCenter issue, I needed to replicate an environment where the vCenter Server had no internet access. This scenario is often seen in production but can be tricky to reproduce in a lab. This post will outline how I solved the issue quickly using incorrect default gateways and static routes.

Configure vCenter for No Internet Access

I deployed a new vCenter Server, using normal processes & correct networking settings. The resulting vCenter could reach the internet.

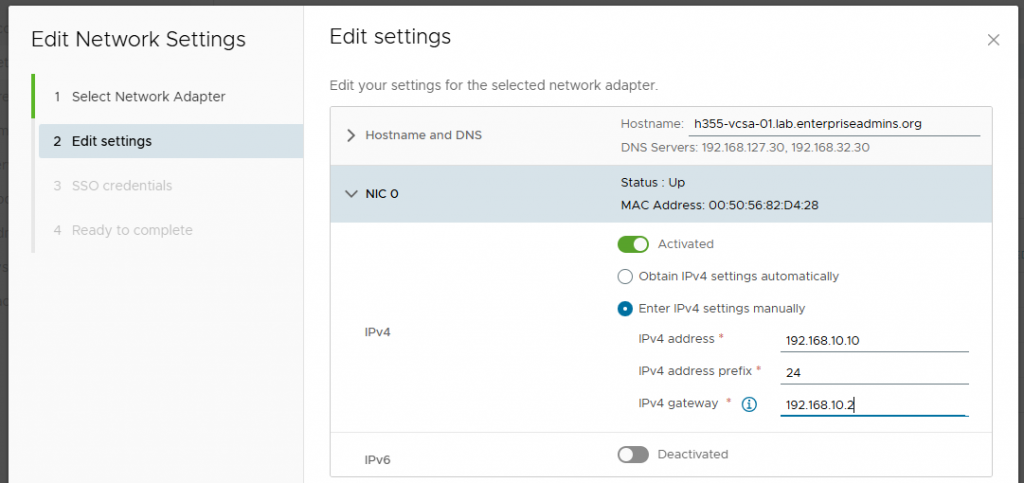
From the virtual appliance management interface (VAMI, port 5480), I selected the Networking option in the left navigation. From there I clicked the ‘Edit’ button in the top right pane. This VCSA only has one physical adapter, so I selected ‘Next’ and changed the IPv4 gateway on the second page to 192.168.0.2. In my lab, this is an unused IP address — the default gateway is actually 192.168.10.1.

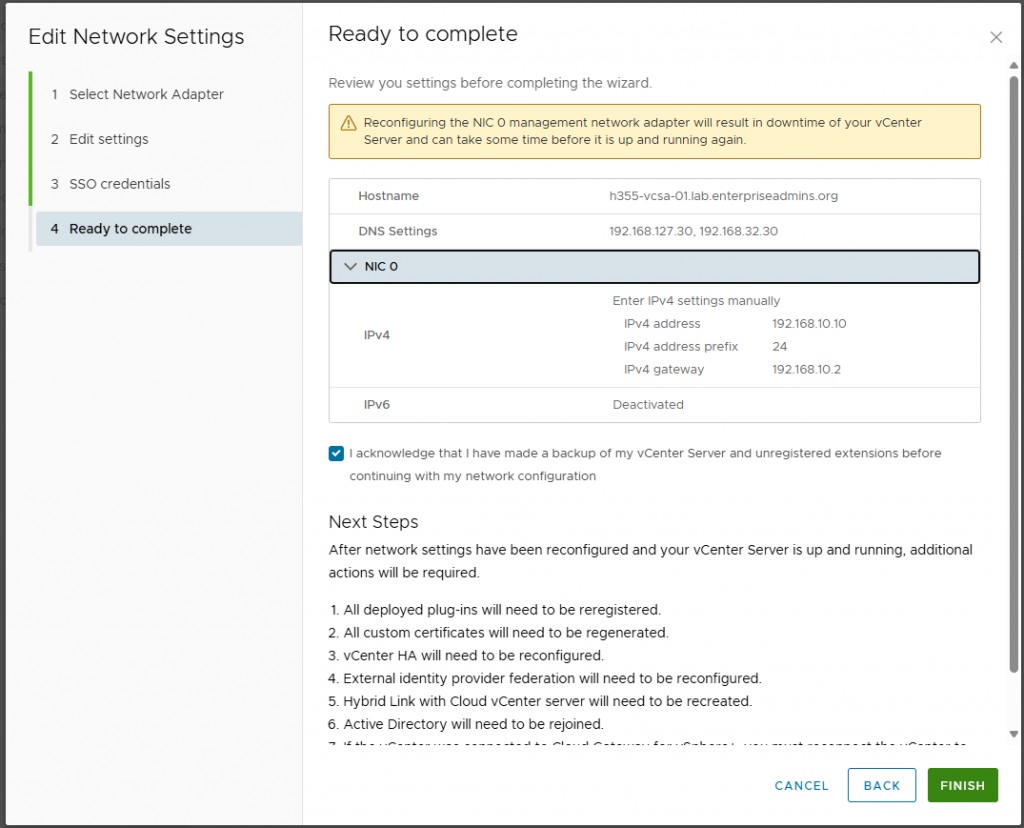
I then continued through the workflow and acknowledged that I was ready to continue.

After making this change, I could ping the vCenter from the local subnet, but not from my admin workstation, which was the expected behavior.

I then modified the /etc/systemd/network/10-eth0.network file to append the following text:

[Route]
Gateway=192.168.10.1
Destination=192.168.0.0/16

This adds a static route so the vCenter Server now knows how to route to all devices, but only in my labs 192.168.0.0/16 network. To make this effective, I ran the following command:

systemctl restart systemd-networkd.service

After restarting networkd, I was able to ping the vCenter from both the local subnet and my admin workstation. However, from the vCenter I was unable to ping non-192.168.x.x addresses. This was the ideal configuration for my specific test.

Restricting Internet Access on a Windows Jump Host

Preventing the vCenter Server from reaching the internet was exactly what I needed. However, I decided to also setup a Windows Server based jump host to connect to this vCenter & I wanted it to be restricted from accessing the internet as well. I used the same process, but in Windows was able to save the configuration without a default gateway provided. To create a persistent static route, I used the following command:

route -P add 192.168.0.0/16 mask 255.255.255.0 192.168.10.1 metric 1

With this route defined, the jump host was able to reach internal addresses but not external addresses.

Adding Selective Internet Access with a Proxy

After blocking all the internet access, there were a few domains that I wished I had access to. To solve this I deployed an Ubuntu Linux VM and turned it into a proxy server by installing one package:

sudo apt install tinyproxy

I selected tinyproxy as it is lightweight, simple, and required minimal config. I edited the /etc/tinyproxy/tinyproxy.conf file, removing a few comments to enable the following settings:

Allow 192.168.0.0/16
Filter "/etc/tinyproxy/filter"
FilterDefaultDeny Yes

This allows the proxy server to listen for all devices in my lab, enables domain level filtering, and denies all requests by default. This allows me to selectively enable specific domains as needed and have logging to know which domains are attempted to be contacted. I can allow a domain by adding it to the /etc/tinyproxy/filter file and the restarting services with sudo service tinyproxy restart. To review which domains are attempted to be contacted, I just run the command:

sudo tail -f /var/log/tinyproxy/tinyproxy.log

I can configure the jump box or vCenter server to use this proxy by specifying its IP address and the default proxy port of 8888 (configurable in the tinyproxy.conf file).

Conclusion

This setup provided a flexible way to test how vCenter and supporting systems behave in restricted environments. By combining static routes with a filtered proxy, I could mimic a realistic enterprise scenario where internet access is tightly controlled—without losing the ability to selectively allow required domains.

Posted in Lab Infrastructure, Virtualization | Leave a comment

MongoDB on Ubuntu: Replica Sets, LDAP, and Aria Operations

Last year I shared a series of posts walking through how to set up and monitor MongoDB with Aria Operations. For reference, here are those articles:

When I originally created those posts, Mongo DB had not yet added support for Ubuntu 24.04, so I used Ubuntu 20.04, as I had a template for that distribution. Recently I noticed these older Ubuntu 20.04 VMs, as Ubuntu 20.04 reached end of standard support earlier in the year. This post will review the updated setup steps to deploy a Mongo DB Replica Set on Ubuntu 24.04.

Installing Mongo DB 8.0 (latest) on Ubuntu 24.04

The Mongo DB documentation is very well written. I followed their steps from https://www.mongodb.com/docs/manual/tutorial/install-mongodb-enterprise-on-ubuntu/#std-label-install-mdb-enterprise-ubuntu. I’ll include a short code block below with the specific steps:

sudo apt-get install gnupg curl
curl -fsSL https://pgp.mongodb.com/server-8.0.asc | \
   sudo gpg -o /usr/share/keyrings/mongodb-server-8.0.gpg \
   --dearmor

echo "deb [ arch=amd64,arm64 signed-by=/usr/share/keyrings/mongodb-server-8.0.gpg ] https://repo.mongodb.com/apt/ubuntu noble/mongodb-enterprise/8.0 multiverse" | sudo tee /etc/apt/sources.list.d/mongodb-enterprise-8.0.list

sudo apt-get update
sudo apt-get install mongodb-enterprise

sudo systemctl start mongod
sudo systemctl status mongod
sudo systemctl enable mongod

After running the above commands, my systems were all running a default MongoDB service and that service was set to run automatically at boot.

I confirmed that I could connect to the instance by running mongosh at the console. This allowed me to connect automatically without specifying a password. While in the mongosh console, I created a dbadmin user account with the root role.

var admin = db.getSiblingDB("admin")
admin.createUser(
   {
       user: "dbadmin", 
       pwd: "VMware1!", 
       roles:["root"]
   })

After getting a successful response that my new user account was created, I exited the mongo shell by typing exit.

Configuring MongoDB for Replica Set and LDAP authentication

Back at the command line, I created a directory to store a security.key file to be used for each node in the replica set. I’ve included the details of these commands below:

cd /opt
sudo mkdir mongodb
sudo chown mongodb:mongodb /opt/mongodb

echo '88157a33a9dc499ea6b05c504daa36f8v2' | sudo tee /opt/mongodb/security.key
sudo chmod 400 /opt/mongodb/security.key
sudo chown mongodb:mongodb /opt/mongodb/security.key

With this file created & properly permissioned, we’ll update our mongo configuration file to specify the path to the security.key file. While we are in the file, we’ll add some additional settings for LDAP auth, as well as define the replica set name. We do this with vi /etc/mongod.conf and then make the following edits:

In the security section, we add:

  authorization: enabled
  keyFile: /opt/mongodb/security.key
  ldap:
    servers: "core-control-21.lab.enterpriseadmins.org:389"
    bind:
      queryUser: "CN=svc-ldapbind,OU=LAB Service Accounts,DC=lab,DC=enterpriseadmins,DC=org"
      queryPassword: "VMware1!"
    transportSecurity: "none"
    authz:
      queryTemplate: "{USER}?memberOf?base"
    validateLDAPServerConfig: true
setParameter:
  authenticationMechanisms: "PLAIN,SCRAM-SHA-1,SCRAM-SHA-256"

In the replication section we add:

  replSetName: svcs-rs-11

After updating the /etc/mongod.conf file on each host in my three node cluster, I restarted the service with the command sudo systemctl restart mongod

After the service restarted, I launched mongosh again. Now that authentication has been enabled, I set my database and then login using the following commnds:

use admin
db.auth({ user: 'dbadmin', pwd: 'VMware1!', mechanism: 'SCRAM-SHA-256' })

Next I initiated the replica set using the following syntax:

rs.initiate( {
   _id : "svcs-rs-11",
   members: [
      { _id: 0, host: "svcs-mongo-11.lab.enterpriseadmins.org:27017" },
      { _id: 1, host: "svcs-mongo-12.lab.enterpriseadmins.org:27017" },
      { _id: 2, host: "svcs-mongo-13.lab.enterpriseadmins.org:27017" }
   ]
})

This took a few seconds, but then returned the message { ok: 1 }. I double checked everything was running as expected by checking status rs.status() which returned details of the replica set, showing member nodes and which were primary vs secondary.

Creating custom role for monitoring and administration

I then created a custom role to be used by monitoring tools, like Aria Operations.

var admin = db.getSiblingDB('admin')
admin.createRole(
    {
        role: "CN=LAB MongoDB Ent Monitoring,OU=LAB Service Accounts,DC=lab,DC=enterpriseadmins,DC=org",
        roles: [ { role: "clusterMonitor", db: "admin" } ],
        privileges: []
    }
)

I also created a role to use for management. I could have done this with a single command by providing both roles when creating the role, but wanted to show an example of modifying an existing role as well.

var admin = db.getSiblingDB('admin')
admin.createRole(
    {
        role: "CN=LAB MongoDB Ent Admins,OU=LAB Service Accounts,DC=lab,DC=enterpriseadmins,DC=org",
        roles: [ "dbAdminAnyDatabase", "clusterAdmin"  ],
        privileges: []
    }
)

db.grantRolesToRole("CN=LAB MongoDB Ent Admins,OU=LAB Service Accounts,DC=lab,DC=enterpriseadmins,DC=org", [ { role: "root", db: "admin" } ] )

Loading sample data

Similar to the previous series of posts, I loaded some sample data into this replica set using the following syntax:

curl https://atlas-education.s3.amazonaws.com/sampledata.archive -o sampledata.archive
mongorestore --archive=sampledata.archive -u dbadmin -p 'VMware1!'

Using mongosh as an LDAP user

Since we have LDAP authentication configured, we can also login to the mongo shell as an LDAP user. The following syntax is an example of how to do so:

mongosh --username "CN=svc-mgdbeadm,OU=LAB Service Accounts,DC=lab,DC=enterpriseadmins,DC=org" --password 'VMware1!' --authenticationDatabase='$external' --authenticationMechanism="PLAIN"

In this case we specify that we want to use an external authentication database (LDAP) and the mechanism as ‘PLAIN’, which we previously enabled as an option when configuring the replica set & LDAP authentication.

Managing databases with a graphical user interface

When demoing the Operations management pack, it is often helpful to interact / show the databases. Workflows such as creating, deleting, renaming a database can be helpful. Doing these demos is often more interesting from a GUI instead of a command line. I recently found mongo-express, a web-based, graphical interface to manage Mongo DB databases. I ran this as a container as a test using the following sytax:

sudo docker run -p 8081:8081 -e ME_CONFIG_MONGODB_URL='mongodb://dbadmin:VMware1!@svcs-mongo-11.lab.enterpriseadmins.org,svcs-mongo-12.lab.enterpriseadmins.org,svcs-mongo-13.lab.enterpriseadmins.org/admin?replicaSet=svcs-rs-11' mongo-express

This connects to the Mongo DB service using our local dbadmin. The console shows us that we can use http://0.0.0.0:8081 to connect to the web interface with the username admin and password of pass. From this web interface we can see / edit / delete our databases during our demos. I’ve since wrapped this up in a docker compose file and exposed it with a reverse proxy to apply an SSL certificate.

Conclusion

With Ubuntu 20.04 out of standard support, refreshing to 24.04 was a necessary step, even in a lab. Getting current by rebuilding this replica set configuration was rather straightforward. Monitoring is continuing to work with the same Aria Operations management pack previously used, with only creating a new data source and reusing the previous credential object.

Posted in Lab Infrastructure, Virtualization | Leave a comment

Simplify Snapshot Management with VCF Operations

Managing snapshots in vSphere environments is a task that folks have dealt with for years. I remember one of my first PowerCLI scripts was one that sent email notifications for snapshots over a week old to review and manually clean them up. In this post we’ll walk through one way of automating this cleanup using VCF Operations Automation Central.

In VCF Operations this is under Infrastructure Operations > Automation Central (or Operations > Automation Central, depending on version) we can create an automated job. There are several tiles available for automated jobs, but for this example we’ll use a ‘reclaim’ job:

For step 1 of our reclaim job, we’ll enter a job name & select ‘Delete old snapshots.’ We have an opportunity to add a description and specify various snapshot details, like only deleting snapshots older than 7 days, filtering by size or matching a specific snapshot name.

For step 2, we’ll define a scope, selecting specific objects that contain the VMs we want this automation to target. In the screenshot below, we’ve picked all of one vCenter, another Datacenter, and a specific cluster from a 3rd vCenter. This allows us to create different job scopes for different types of environments.

In step 3, we can define additional filter criteria. This is incredibly flexible. In the example below I’ve specified 3 different criteria combined with ‘and’ logic.

  • Tag ‘SnapshotPolicy’ not exists = means that there is no tag assigned to this VM with the category SnapshotPolicy. This would allow me to assign this tag category to some VMs with tags like ‘1 month’ or ‘manual’ and have separate jobs for them. This ‘not exists’ job would get all other VMs.
  • Metrics CPU|Usage (%) is less than 50% = would allow me to exclude VMs that are busy doing something.
  • Properties Configuration|Number of VMDKs is less than 5 = excludes VMs that have a lot of VMDKs.

We can add additional criteria on other metrics, properties, tags, object names, etc as needed.

On the final step 4 we can schedule how often this task runs. In my example this job is only running on Saturdays for the next year, and it will send a email updates as needed.

Conclusion

VCF Operations Automation Central is a very powerful tool and can be used to automate routine tasks such as snapshot removal. If you’re not yet using Automation Central, i’s worth exploring to streamline operations and reduce manual effort.

Posted in Lab Infrastructure, Virtualization | Leave a comment