I recently read an interesting article on the vSphere Blog: https://blogs.vmware.com/vsphere/2020/01/microsoft-ldap-vsphere-channel-binding-signing-adv190023.html, which states Microsoft is making a change to the default behavior of LDAP servers that are part of Active Directory. This change will require secure LDAP channel binding by default, and is scheduled to be implemented in March 2020. The article goes on to say that vCenter using Integrated Windows Authentication (IWA) is not affected, so my lab should be fine…right? I have systems other than vCenter connecting over LDAP, so I have a need to double check. I found a really good article from 2016 ( https://docs.microsoft.com/en-us/archive/blogs/russellt/identifying-clear-text-ldap-binds-to-your-dcs) that shows how to increase logging levels and also includes an event viewer view and PowerShell script to find these events. However, I wanted to make this same data visible as a dashboard in Log Insight. The following post will recap the required steps to build a similar dashboard for your environment.
The first step was to enable the additional logging. I did this by adding the following registry key to all domain controllers in the environment. I did this in a lab with very few domain controllers, so I just ran this command on each, one at a time:
# Enable Simple LDAP Bind Logging
reg add HKLM\SYSTEM\CurrentControlSet\Services\NTDS\Diagnostics /v "16 LDAP Interface Events" /t REG_DWORD /d 2
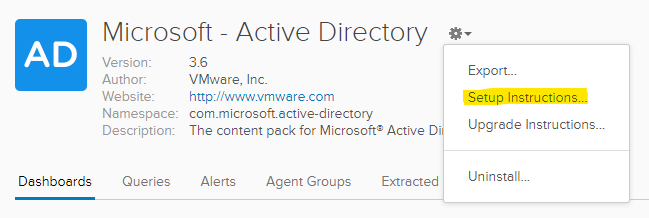
My domain controllers were already running the Log Insight agent and the Active Directory content pack was already installed and configured. You can check this in your environment by going to Settings > Content Packs. If you do not see Microsoft-Active Directory listed under the Installed Content Packs header, you can get it from the Marketplace. When you install the content pack from Marketplace, it will display a set of instructions you need to follow to enable appropriate collection. If you have already installed the content pack, you can find these setup instructions by browsing to the content pack, clicking the ‘gear’ icon and selecting ‘setup instructions’ (screenshot below):
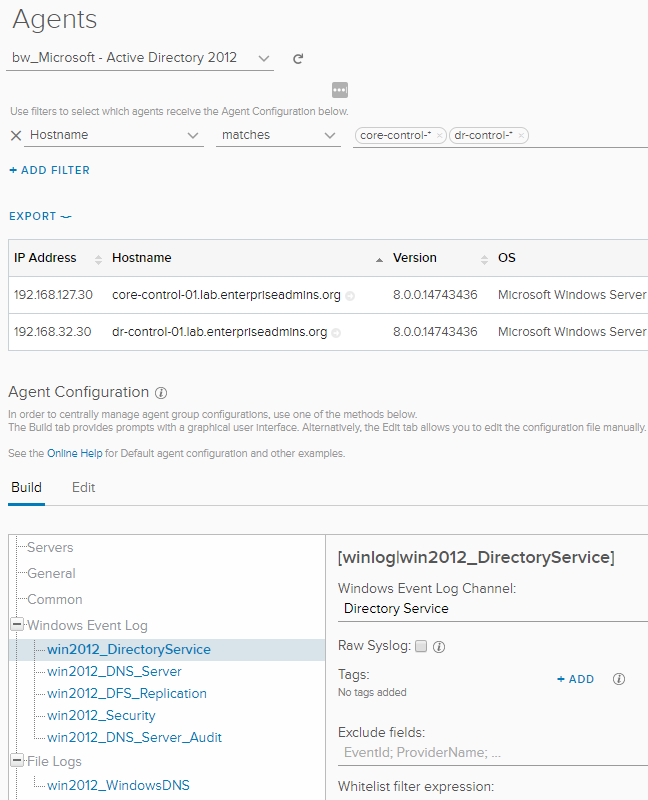
For example, you may need to enable additional audit logs in your Default Domain Controllers policy – the details are included in the popup. You will also need to create a copy of the agent configuration from Settings > Administration > Agents (among other settings, this will ensure the Directory Services log is captured — and that is where event 2889 is logged). Here is a sample of the agent configuration, showing that our newly created configuration applies to both of my lab domain controllers.
Now that Windows is logging eventid 2889, and Log Insight agent is picking that event up, we can focus on extracted fields and dashboards in Log Insight.
Extracted Fields
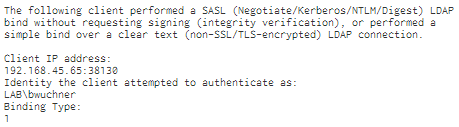
An extracted field is a regular expression definition of text we want to find in our event. If we look at a sample of one such event (screenshot below) we can see that there three fields that we likely want to capture:
– Client IP Address
– Identity the client attempted to authenticate as
– Binding Type
The easiest way to extract this event is to highlight the text we want to extract. A popup will appear and give us filtering choices as well as an option to extract a field. If we select that option, a new field definition will appear to the right of the page.
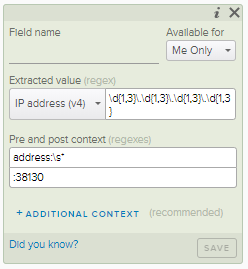
We can see that the default criteria is looking for an IPv4 address that appears after the text address: and before the text :38130. This is close to the text we want, but the pre-text is not as specific as we could be and the post text is too specific (the source port can be any random high numbered port). We can edit this default criteria
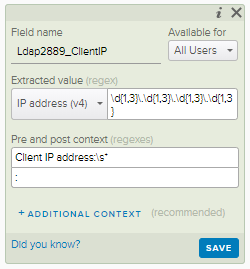
– Pre text: Client IP address:\s* [adding the Client IP prefix as shown in the example event]
– Post text: : [removing the ending port number, leaving only the single colon ]
We will also give this field a name (Ldap2889_ClientIP) and make it visible to all users. The resulting field definition should look like this:
Now that we know how to extract the data we want, we will repeat the process to create other extracted fields for Ldap2889_Identity and Ldap2889_BindingType.
Dashboard
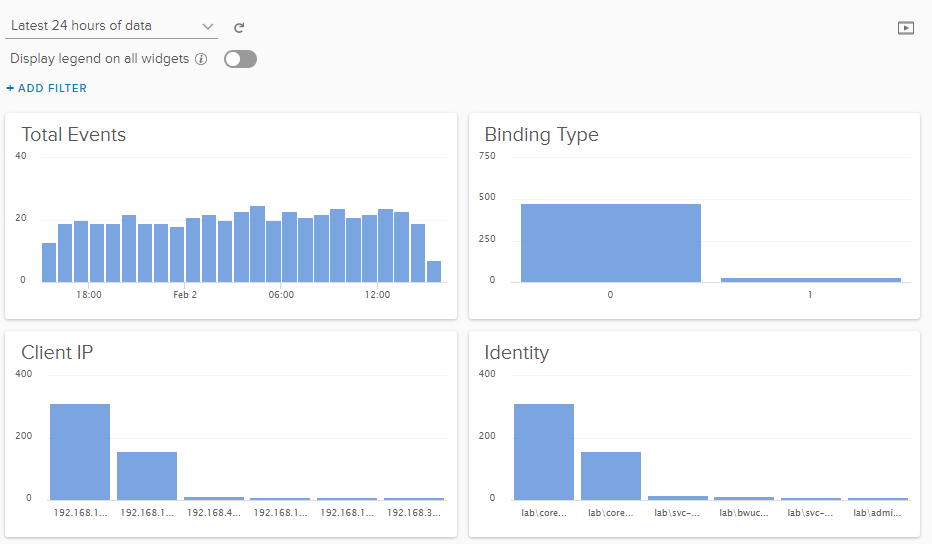
Once we have extracted interesting fields, we can build visuals to consume that information. The easiest way to do this is from Interactive Analytics. We start by applying filters — in this example we add a filter for eventid = 2889. We can then add interesting groups of data. In the top section of interactive analytics we can see a timeline of findings. In the bottom left area we see a couple of drop downs. The first one starts ‘Count of events,’ which is typically the most logical grouping. There are other choices available so you should review those options. The second drop down list defaults to ‘over time,’ and this one is the one that is typically adjusted. For example, we can select ‘Non-time series’ and then Group By one of our custom extracted fields — for example, Ldap2889_ClientIP.
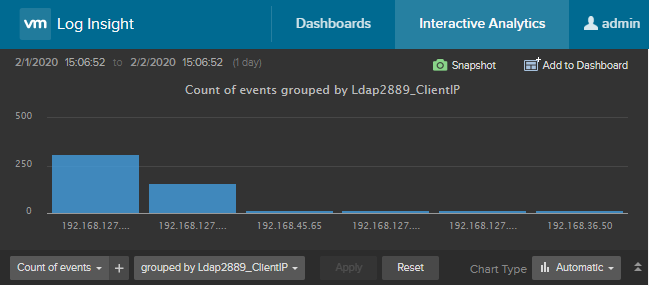
Using the options to the right, we could easily turn this visual from a column to a pie graph. Once we have it the way we like, we can use the ‘Add to Dashboard’ button in the top right to save this view for later. The popup will ask us for a visual name, and then to select the dashboard where we’d like to see this data. We can make a new dashboard from this same screen if needed, and even share with all other users. We can create other visuals, for example, groupings by Ldap2889_Identity or BindingType, or even include some time series metrics to see when most of the logins are occurring. Looking at my dashboard, I can see that I may have a bit more work ahead of that March 2020 deadline.