The Skyline Collector 3.3 release [release notes] recently added support for vRealize Log Insight / Aria Operations of Logs to the Skyline platform. As described in the release notes, only local authentication is supported in this release. I had not created a local user in vRealize Log Insight before, so this post will describe the process of where/how to complete this process.
Step 1:
In Log Insight, select Configure > SMTP Server and confirm that SMTP email configuration is defined for sending mail. If you need an easy SMTP server for your lab, check out the inbucket docker container, which is described in a previous post.
This will send an email to the address provided with a link that can be used to set the password for this user.
Step 3:
Check email provided for this new user and use the included link to set the account password.
Step 4:
Login to Skyline Collector 3.3 appliance. Click Configuration > Products > vRealize Log Insight > Add vRealize Log Insight. Enter your Log Insight hostname (or VIP) and the credentials for the user you configured in step 2. Remember, this username is case sensitive.
After a few minutes you should see a green check next to your new endpoint configuration. You can then check the Skyline Advisor in a few hours to confirm that everything is visible as expected.
My homelab has a small UPS to help carry through short power ‘blips’ that occur from time to time — it is not sized for prolonged outages. As such, I don’t have any automation to detect/respond to these on battery events. Recently some storms rolled through, causing a power outage long enough that everything in the lab powered down hard. This has happened to me before and I always learn something from the recovery efforts. This post will recap some of the latest lessons learned.
Lesson #1: VMFS locking
My lab has one ESXi host that I like to consider a ‘disaster recovery’ host. I try to limit any sort of external dependencies, it uses standard virtual switches, local disk, etc. and only runs a few VMs, like a secondary domain controller / DNS server, backup target for VCSA backups, and the repository for a backup system. When I’m powering things up, this is the first host that I bring online and I power on these VM guests before any others. However, this time powering on a guest resulted in a “Failed to power on virtual machine dr-control-21. Insufficient resources.” error message. I tried another VM on the same host/storage and received the same error. I tried a few initial troubleshooting steps:
Reboot host.
Confirm memory/CPU counts match expected values to rule out resource failure.
Verified host licensing wasn’t expired.
SSH to host and manually create/delete files from VMFS datastore.
Attempt to power on a VM on a different disk on the same host — success.
All of these steps checked out okay, so next I went to the vmkernel.log file and watched it as I tried to power on a VM on this specific SSD. I included a few entries from that log below:
2023-02-28T14:34:49.190Z cpu0:265717)WARNING: SwapExtend: 719: Current swap file size is 0 KB.
2023-02-28T14:34:49.190Z cpu0:265717)WARNING: SwapExtend: vm 265717: 727: Failed to extend swap file. type=regular from 0 KB to 10240 KB. currently 0. status=Busy

2023-02-28T14:45:44.724Z cpu1:264688 opID=44d4b0b6)Fil6: 4094: 'dr-esx-31_ssd': Fil6 file IO (<FD c17 r6>) : Busy
2023-02-28T14:45:44.724Z cpu1:264688 opID=44d4b0b6)Fil6: 4060: ioCtx: 0x454917beddc0, world: 264688, overallStatus: Lost previously held disk lock, token: 0x0, tokenStatus: N, txnToken: 0x0, txnTokenStatus: N, totalIOSize: 3761, maxIOLength: 3761
My next thought was that the physical SSD drive had failed. This is a consumer grade device that has been running 24×7 for years, so failure wouldn’t be a huge surprise. To check this, I found the ID of the disk using esxcli storage core device list. I then checked the physical disk with the following command:
esxcli storage core device smart get -d t10.ATA_____WDC_WDS500G1B0B2D00AS40__________________163763421472________
This returned a table that showed no fail or error counts for the disk, suggesting that it was physically healthy. I then remembered a tool that I haven’t used before, vSphere On-disk Metadata Analyzer (voma) described here: https://docs.vmware.com/en/VMware-vSphere/7.0/com.vmware.vsphere.storage.doc/GUID-6F991DB5-9AF0-4F9F-809C-B82D3EED7DAF.html. I was at a point where I assumed these VMs were lost and would need rebuilt anyway, so why not give this a try first? I removed the VMs on this disk from inventory and rebooted the host so that everything would be as clean as possible. I then ran voma to check VMFS with the following syntax:
Phase 1: Checking VMFS header and resource files
   Detected VMFS-6 file system (labeled:'dr-esx-31_ssd') with UUID:5f80a2f2-d98ebf77-71a5-b8aeed72cacf, Version 6:82
   Found stale lock [type 10c00003 offset 153174016 v 10, hb offset 3440640
         gen 247, mode 1, owner 612cc20b-2b16ed7f-e19d-b8aeed72cacf mtime 264072
         num 0 gblnum 0 gblgen 0 gblbrk 0]
   Found stale lock [type 10c00003 offset 153214976 v 8, hb offset 3440640
         gen 7, mode 1, owner 5f80a174-7a6f9c7f-4a06-b8aeed72cacf mtime 2375897
         num 0 gblnum 0 gblgen 0 gblbrk 0]
   Found stale lock [type 10c00003 offset 287481856 v 6, hb offset 3440640
         gen 7, mode 1, owner 5f80a174-7a6f9c7f-4a06-b8aeed72cacf mtime 2375696
         num 0 gblnum 0 gblgen 0 gblbrk 0]
<redacted to save space>
Phase 3: Checking all file descriptors.
   Found stale lock [type 10c00001 offset 71827456 v 5688, hb offset 3440640
         gen 609, mode 1, owner 63fdfacc-c6c0eb27-c5e2-b8aeed72cacf mtime 2147
         num 0 gblnum 0 gblgen 0 gblbrk 0]
   Found stale lock [type 10c00001 offset 80044032 v 2493, hb offset 3440640
         gen 239, mode 1, owner 60d0b4b3-52c8ad5d-fce9-b8aeed72cacf mtime 1643
         num 0 gblnum 0 gblgen 0 gblbrk 0]
<redacted to save space>
Total Errors Found:           2
The stale lock errors did seem to align with the second set of vmkernel logs included above. I went ahead and ran the command in fix mode with the syntax:
Once complete I re-ran the check. It still showed one error (down from the origional 2), but the stale lock entries were no longer present. I re-registered the VMX files that I had previously removed, and great news — the affected VMs could be powered on!
The lesson here was a reminder to be patient when troubleshooting. Start with the easiest steps first, keep notes on what has been tried, and that logs are your friend. Also, in the real world, avoid having your disaster recovery and production environments share the same power feed.
Lesson #2: Its always DNS
While troubleshooting the VMFS issue above, I decided to power on other pieces of my lab, a Synology NAS and the hosts in my main ESXi cluster. This is different from my normal order of operations, as I normally wait for the ‘disaster recovery’ VMs to come online first. However, I didn’t know how long it would take to resolve that issue, and was thinking a rebuild of the backup domain controller / DNS server was going to be required. Promoting a new/replacement domain controller was going to require that the primary system come online anyway.
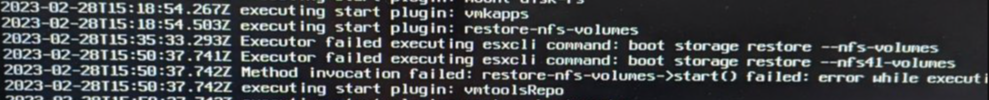
I waited an unusually long time for the clustered ESXi hosts to boot. I could ping them, but wasn’t able to reach the web interface to login. After awhile I gave up, powered one system off completely and focused on getting just one online. I power cycled that other system and gave it 10-15 minutes to boot… but still nothing. This host would normally power up in 3-5 minutes, so something else was wrong. I powered off the host again and rearranged gear so I could connect an external monitor. I powered on the system, and to my surprise ESXi was actually booting — I had assumed that there was going to be an error onscreen early in the boot process. I pressed ALT+F1 to watch the boot process. I was distracted for a bit, but when I looked back I finally saw the culprit causing my delay and was able to grab a picture:
ESXi boot process showing nfs-volumes with delay
The process to bring my nfs-volumes online had a significant delay, over 30 minutes. I had not encountered this before, and immediately assumed something was wrong with my NAS. I logged in to its UI and everything looked healthy, and I was able to connect to an NFS mount as a test… so the NFS target wasn’t the cause of my problem. Since I finally waited long enough for the ESXi host to boot, I went to the command line and attempted to ping the IP addresses of the NAS, thinking I had a network connectivity / VLAN problem on my ESXi host facing switch ports. The vmkping commands worked without issue. Then it hit me. The VMFS issue described above prevented my disaster recovery DNS server from coming online, so when these ‘production’ hosts came online, they were not able to resolve the _name_ of my NFS server, and my NFS datastores were likely mounted by hostname, not IP address. I went to edit my ESXi hosts /etc/hosts file to test this theory, but noticed a line that said #Do not modify this file directly, please use esxcli. I checked the esxcli syntax and found the command I needed:
esxcli network ip hosts add --hostname=core-stor02.lab.enterpriseadmins.org --ip=192.168.56.21
I confirmed the /etc/hosts file included the expected entry after running the command. I then rebooted the ESXi host — it came back online quickly, datastores were present, and VMs appeared. Everything powered on as expected.
Lesson learned. My ‘production’ hosts were actually dependent on name resolution being provided by the disaster recovery environment. I’ve added this host file entry on both of my management hosts (where primary DNS runs) so that I don’t encounter this issue again.
Lesson #3: Documentation is important
I was lucky in that I remembered hostnames/IP addresses used in my lab. If this were a larger environment, with more admins each knowing just their piece of the puzzle, this could have been much harder to recover. Some regular documentation of how things are setup, such as the output from an AsBuiltReport would have been valuable for this environment — especially if that output was store outside of the lab. In my case I had some documentation stored on the filesystem of a VM on my disaster recovery host — and that VM was impacted by the VMFS issue as well. Going forward, I may try to send similar report output to a third party repository every month so that it is stored completely outside of the lab it is documenting.
Validity periods for SSL certificates keep shrinking, requiring more frequent certificate replacements. Something that once only needed done every 3 or so years is now required every year. With these increased demands it is common to want to automate this task. This article will show how to request and replace a vCenter Server certificate using a vSphere API and PowerCLI.
Background
Before we start replacing certificates it is important to understand the various options available for managing vSphere certificates. In this article I’ll be focusing on automating the steps for the Hybrid Mode, where we only replace the certificate used by vCenter Server, and we let the default configuration of VMCA handle all the ESXi hosts. The various options are well documented here: https://blogs.vmware.com/vsphere/2020/04/vsphere-7-certificate-management.html.
The GUI Way
Now that we know which certificate replacement method we want to use, we’ll first explore how to complete this certificate replacement in the HTML5 UI. We’ll navigate to vSphere Client > Administration > Certificates > Certificate Management. From here we can see the existing Machine_Cert that is used, which expires in November 2023.
vCenter Server HTML5 UI Machine_Cert
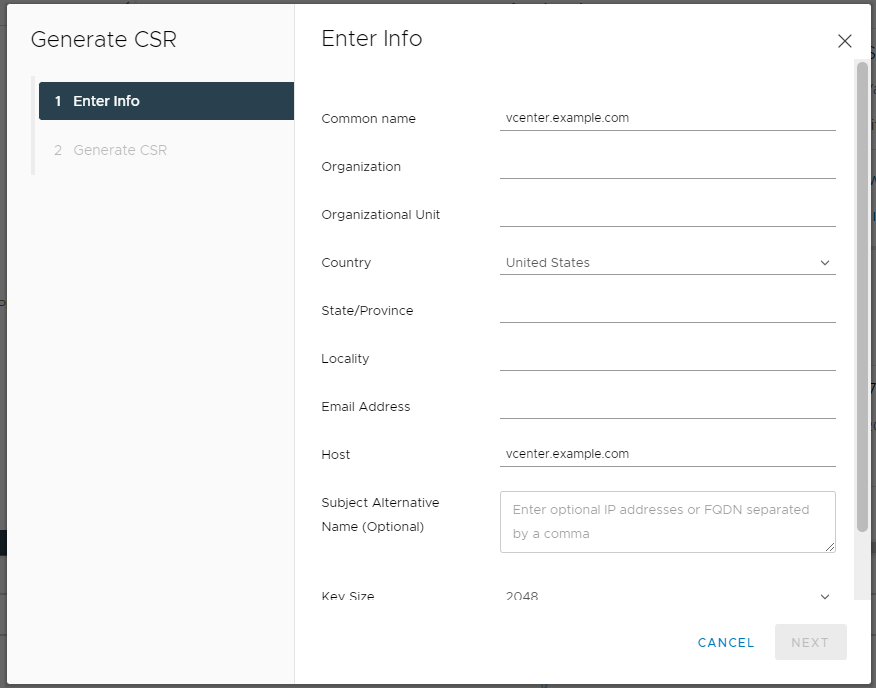
In this tile with our certificate detail, we see an Actions drop down, which contains choices to Renew, Import and Replace Certificate, and Generate Certificate Signing Request (CSR). When I do this in the HTML5 UI, it is typically two steps. First, I create a CSR, which prompts me to enter information about the certificate I’d like to request.
vCenter Server – Generate CSR form
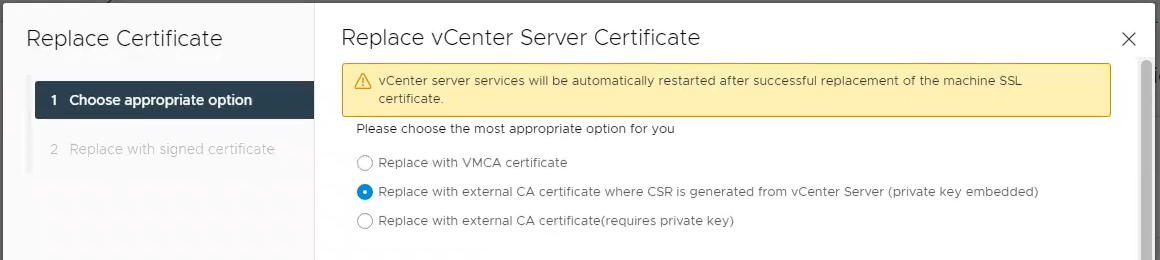
Once this is complete, I’m provided with a long string of text (the CSR) which I need to send to my certificate management / crypto folks for processing. They will return a certificate to me. You may have noticed I do not see the private key at any point during this process — this is because vCenter keeps this information private. Once I have my certificate, I can go back to the tile and provide the certificate files — the private key is already there.
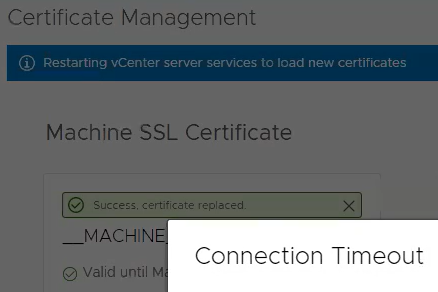
Replace certificate screen, showing private key is embeddedStep 2, showing the Machine SSL Certificate and Trusted root certificates being provided.UI showing success and that vCenter server services are restarting
It can take some time for services to restart, but I should have another year before I need to replace this certificate again.
This was very straight forward in the UI, the next steps will cover doing the same process using the vSphere API.
Automating the Certificate Signing Request
When browsing vSphere Client > Developer Center > API Explorer, I see two interesting headings under the vcenter API endpoint we can see an entry for certificate_management/vcenter/tls_csr. The description states “Generates a CSR with the given Spec.” If we connect to the vSphere Automation SDK server with Connect-CisServer, we can get this specific service and create the spec. From there, we can populate all the fields and then create our new CSR. Here is a code block showing all these steps with some dummy data.
As in the section where we discussed using the GUI, we now need to provide our CSR to the certificate management folks / crypto team. They are typically responsible for requesting/creating certificates. Depending on the Certificate Authority in use, this step could also be automated, but it is outside the scope of this article.
Replacing the Certificate
Once we have our certificate, in my case a pair of cer files (one for my vCenter Server and one for the root cert of the CA), we can return to our PowerCLI window. I was able to quickly request/approve a new certificate and my PowerCLI session was still open so I didn’t need to use Connect-CisServer again, however you may need to reconnect days later, thats no problem and will work fine. I used Get-Content to read in the two cer files, but by default that reads line by line. Therefore, I used -join to put each line into a single variable, and for good measure removed any leading/trailing spaces with .trim() as I’ve seen that cause issues with certificates in the past. I then used the certificate_management/vcenter/tls service and created the sample specification. This results in a new object being created where cert is required and the other properties (key and root_cert) are optional. For my case I specified just the cert and root_cert since my CSR was generated/stored by the vCenter Server Appliance already.
After running that $tls.set method on the last line of the code block above, vCenter services automatically restart, just like in the UI example.
Conclusion
This article shows how similar the HTML5 UI is to these specific APIs for certificate replacement. I hope this helps you automate this repeatable task.
Too frequently I login to my Skyline Collector and am immediately required to change the password. Follow along with me as I explain how I figured out how to use automation to reduce the frustration of this process.
The Skyline Collector admin password will expire every 90 days. Because it’s not necessary to login to the collector frequently, it is common that when I do login, I’m force to immediately change the password. I began looking for an option to change this password programmatically, thus enabling the ability to schedule a task that would update the password before it expired, preferably every 30 days or so. That way when I go to login the password doesn’t need to be immediately changed and I can move along with my task.
Finding the API method
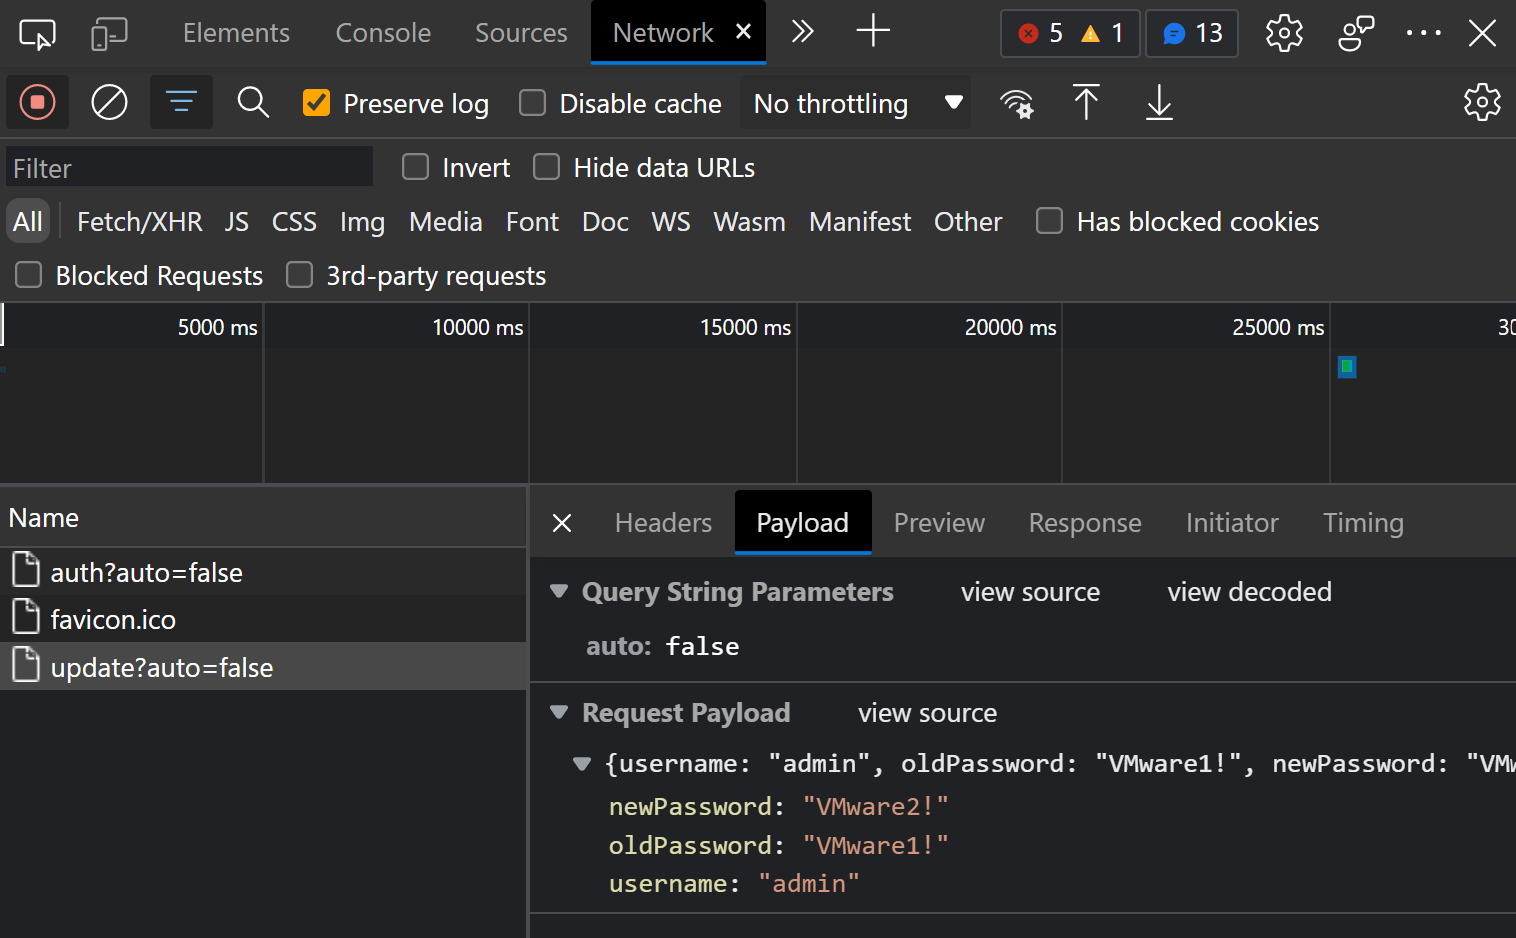
To find the API method being used, I opened the developer tools in my browser, switched to the Network tab, then began watching the monitor while I changed the admin password for my Skyline Collector. When I clicked the button to change password, the ‘request URL’ on the Headers tab shows that the method called is /api/v1/auth/update?auto=false (picture below):
On the ‘Payload’ tab I can see the JSON body that was posted to the /api/v1/auth/update method in the request URL (from the above screenshot). The request body looks like this:
Write a Script to Automate the Password Change
Knowing the API method called as well as the details of the payload gives us the details that we need to write some code. We could use any tool/language, but having a prefernce towards PowerShell I chose that path. The below example does just that — and the results showed Password updated successfully!
$serverName = 'h027-skyline-01.lab.enterpriseadmins.org' # variable for Skyline Collector name/IP.
$changePassBody = @{'username'='admin'; 'oldPassword'='VMware1!'; 'newPassword'='VMware2!'} # JSON payload
# Following line will use variables above to POST the request
Invoke-RestMethod -method POST -Uri "https://$serverName/api/v1/auth/update?auto=false" -Body ($changePassBody | ConvertTo-Json) -ContentType "application/json"

# Output of Invoke-RestMethod from above
message
-------
Password updated successfully.
With this test successful, I tested the code against a collector appliance with an expired password and it worked there also.
It’s outside of the intent of this brief article but to have this be a complete solution, the remaining tasks to fully automate this process would include:
Reading in a complete list of Skyline Collectors (either from a list in the script or CMDB solution)
Retrieving the current password for each collector (from a privileged access management tool like Cyberark / Thyotic)
Auto-generating a new password for each collector
Storing the new password in the privileged access management vault for each collector
Schedule this as a recurring task
Hopefully this has given you a helpful example of using your browsers Developer Tools to investigate APIs as well as writing a sample script to use what you find.
I was recently listening to an episode of the Unexplored Territory podcast (episode #023 – Introducing Oracle Cloud VMware Solution with Richard Garsthagen). At the end of each episode, the hosts ask the guest about a technology that should be explored. The response to this question is the first time I heard about steampipe.io. I made a note to take a look at this open source project and wanted to share my notes on getting started.
Steampipe is a SQL like query language for various plugin endpoints, such as AWS, Azure, CSV files, GCP, IMAP, LDAP, VMware vSphere, among others. Plenty of other tools exist to query these endpoints, but this is the first I’ve seen where the exact same syntax can be used to query/join all of them in one result set.
To get started, I decided I would use the prebuilt container image (Using Containers | Documentation | Steampipe). The first step was to create a new directory to store some configuration files. Also, as the processes in the container image run as a non-root user, I made this user (uid 9193) the owner of the folder. Finally, as described in the documentation, I created an alias so that sp could be entered to interact with the container.
# create configuration folder
mkdir -p /data/container/steampipe/sp/config

# make the non-root steampipe user the owner of this configuration folder
chown 9193 /data/container/steampipe/sp/config

# alias the command
alias sp="docker run \
  -it \
  --rm \
  --name steampipe \
  --mount type=bind,source=/data/container/steampipe/sp/config,target=/home/steampipe/.steampipe/config  \
  --mount type=volume,source=steampipe_plugins,target=/home/steampipe/.steampipe/plugins   \
  turbot/steampipe"
Once the folder is defined and our alias is available, we are now able to install Steampipe plugins. For my example, I’m only using the VMware vSphere and CSV file plugins, but you should explore the Steampipe documentation for other available options.
After installing the plugins, we should see a few spc files that were automatically configured.
root@lab-dock-14 [ ~ ]# cd /data/container/steampipe/sp/config
root@lab-dock-14 [ /data/container/steampipe/sp/config ]# ls -lh
total 16K
-rw-r--r-- 1 9193 root 1.8K Feb 12 20:34 csv.spc
-rwxr-xr-x 1 9193 root  971 Feb 12 20:34 default.spc
-rw-r--r-- 1 9193 root   50 Feb 12 20:34 steampipe.spc
-rw-r--r-- 1 9193 root  295 Feb 12 20:34 vsphere.spc
There is one spc file for each plugin. We can review these files to see the default configuration, by default the files contain some of the available syntax, but for our simple example we are going to create our own files. To start with we are going to create a very simple CSV file in the /data/container/steampipe/sp/config directory, since that path already has a bind map to /home/steampipe/.steampipe/config inside of the container. Our example CSV file will only contain two columns, one for a server_name and another for the owner. The contents of this server-owner.csv file will look like this:
To tell steampipe how to find the CSV file, we are going to create a new csv.spc file. I did this by renaming the default csv.spc (with the syntax mv csv.spc csv.spc.old) and then created a new file (with vi csv.spc). Our new file only contains the following information:
This is a very straightforward file — it shows that we are using the CSV plugin and specifically looking at the server-owner.csv file. Lets investigate this CSV file to see how things work. First up, we will enter the interactive query mode using sp query and then do a very basic select all statement against the server-owner file. Then we will add a bit more, just to get the hang of SQL again by adding a where clause. Finally, we will .quit the query editor. The output of these commands can be seen below.
root@lab-dock-14 [ /data/container/steampipe/sp/config ]# sp query
Welcome to Steampipe v0.18.5
For more information, type .help
> select * from "server-owner"
+-----------------+----------------+---------------------------+
| server_name     | owner          | _ctx                      |
+-----------------+----------------+---------------------------+
| beet-farm-01    | Dwight Schrute | {"connection_name":"csv"} |
| core-control-21 | Brian Wuchner  | {"connection_name":"csv"} |
| core-vcenter01  | Brian Wuchner  | {"connection_name":"csv"} |
+-----------------+----------------+---------------------------+
> select server_name from "server-owner" where owner ilike '%dwight%'
+--------------+
| server_name  |
+--------------+
| beet-farm-01 |
+--------------+
> .quit
Working with a CSV file is a basic example and we are only using it above to demonstrate how this would work. The article promised we’d cover VMware vSphere, so we will do that next.
To connect to vSphere we previously installed the theapsgroup/vsphere plugin. We now need to define a spc file that tells it where to find the vSphere environments, just like we did with the path to the CSV file before. I start by backing up the default file (mv vsphere.spc vsphere.spc.old) and then creating a new file (vi vsphere.spc). This new vsphere.spc file will have a few more required attributes than the csv.spc from earlier, as we need to pass in server name, username, password, etc. Here is the sample vsphere.spc file from my lab.
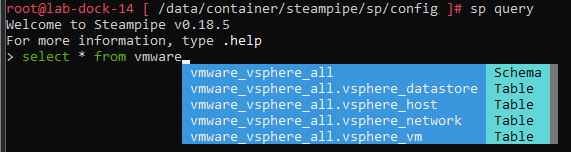
As you can see, I have three different VMware vSphere environments listed, with plugin name, server name, and other details. In addition, there is an aggregator connection that groups all of these environments together. I could have multiple aggregations defined, such as one for prod and another for development instances. Lets run a few test queries just like we did with the CSV example above.
Once we enter the interactive query mode, we will see some autocompletion samples showing what tables are available for our vSphere data. The common stuff like datastore, host, network, and VMs are present.
Ok, this was fun. We can now query CSV files and vSphere data as if we were using a SQL database. This is interesting, but what becomes really powerful is when we tie this together. Since our data is in the same place/format, we can do more complex SQL queries that join one or more data sources together. In the next example, we will return a list of some VM details, along with the owner information from our CSV file.
These are just some examples to get started. If you check out the steampipe.io site, you’ll find more examples and additional plugins covering other technologies, such as net that would allow you to query an SSL certificate (among many other things), ldap which can query LDAP/Active Directory, and other plugins for many cloud providers like AWS and Azure.